Liability Overview Redesign
Role
Product Designer
Researcher
Product Manager
responsibilities
Discovery
User Research
Visualization
company
Happening
team
One woman bend
Timeframe
Discovery // 4 weeks
Design // 2 weeks
2025
Overview
Overview
Problem
Solution
Reflection
Impact
What?
Problem
Design process & leadership
Problem
Solution
Reflecion
Biggest problem was that we have a tool almost no one is using. While there are 264 possibe users, we have only a few. And those few are stugling with performance issues and too many missing information that would make a tool usable in a first place.
This case study explores the redesign of a liability overview tool aimed at improving traders' risk assessment and decision-making. It examines whether a more intuitive and comprehensive interface is key to enhancing user adoption and optimizing financial exposure management.
02
03
06
07
08
H1
H2
05
04
5
16
6
Days
Questions
Participants
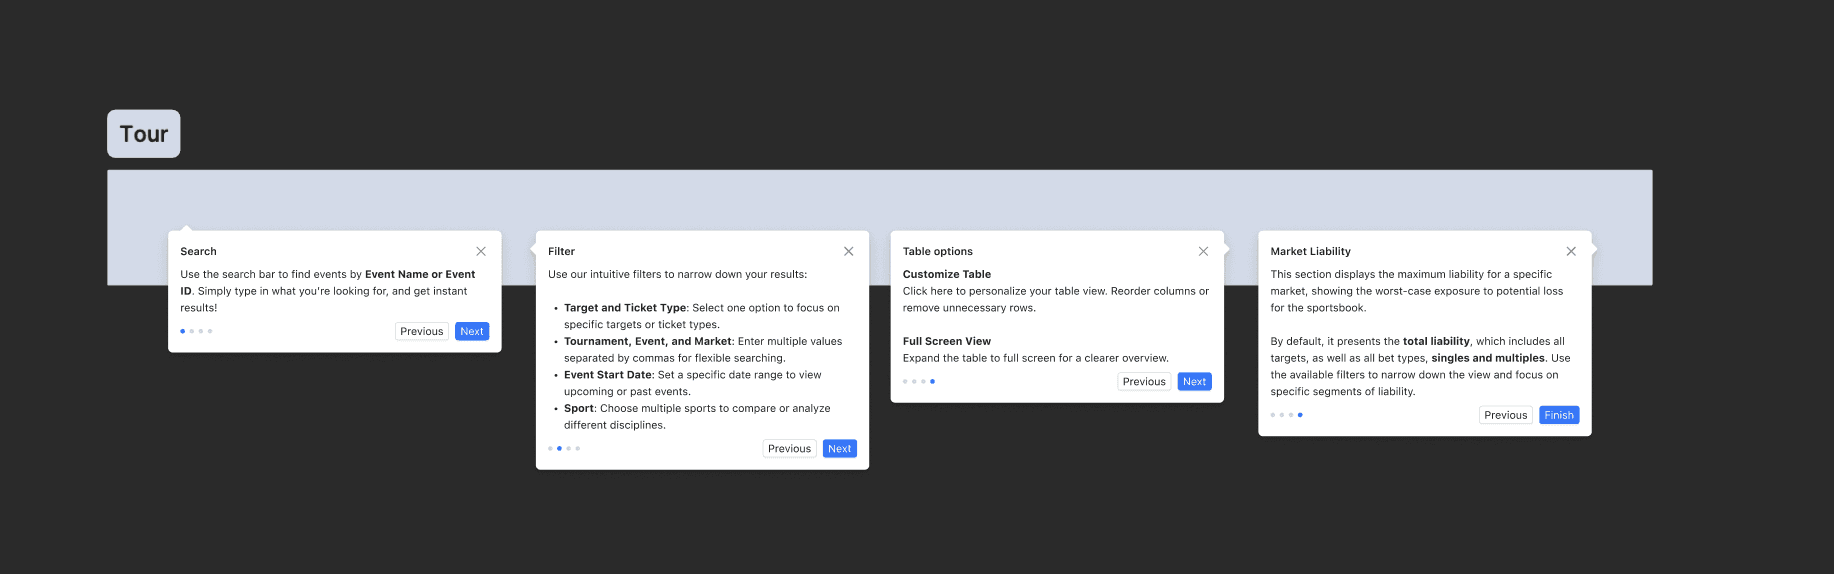
To address the tool's usability challenges, I implemented an onboarding tour to clarify on-screen elements and ensure comprehension. This tour will also serve as a platform for communicating future updates.
Early data indicates a strong impact, with 68% adoption among the target user base and 48% weekly active users.
01
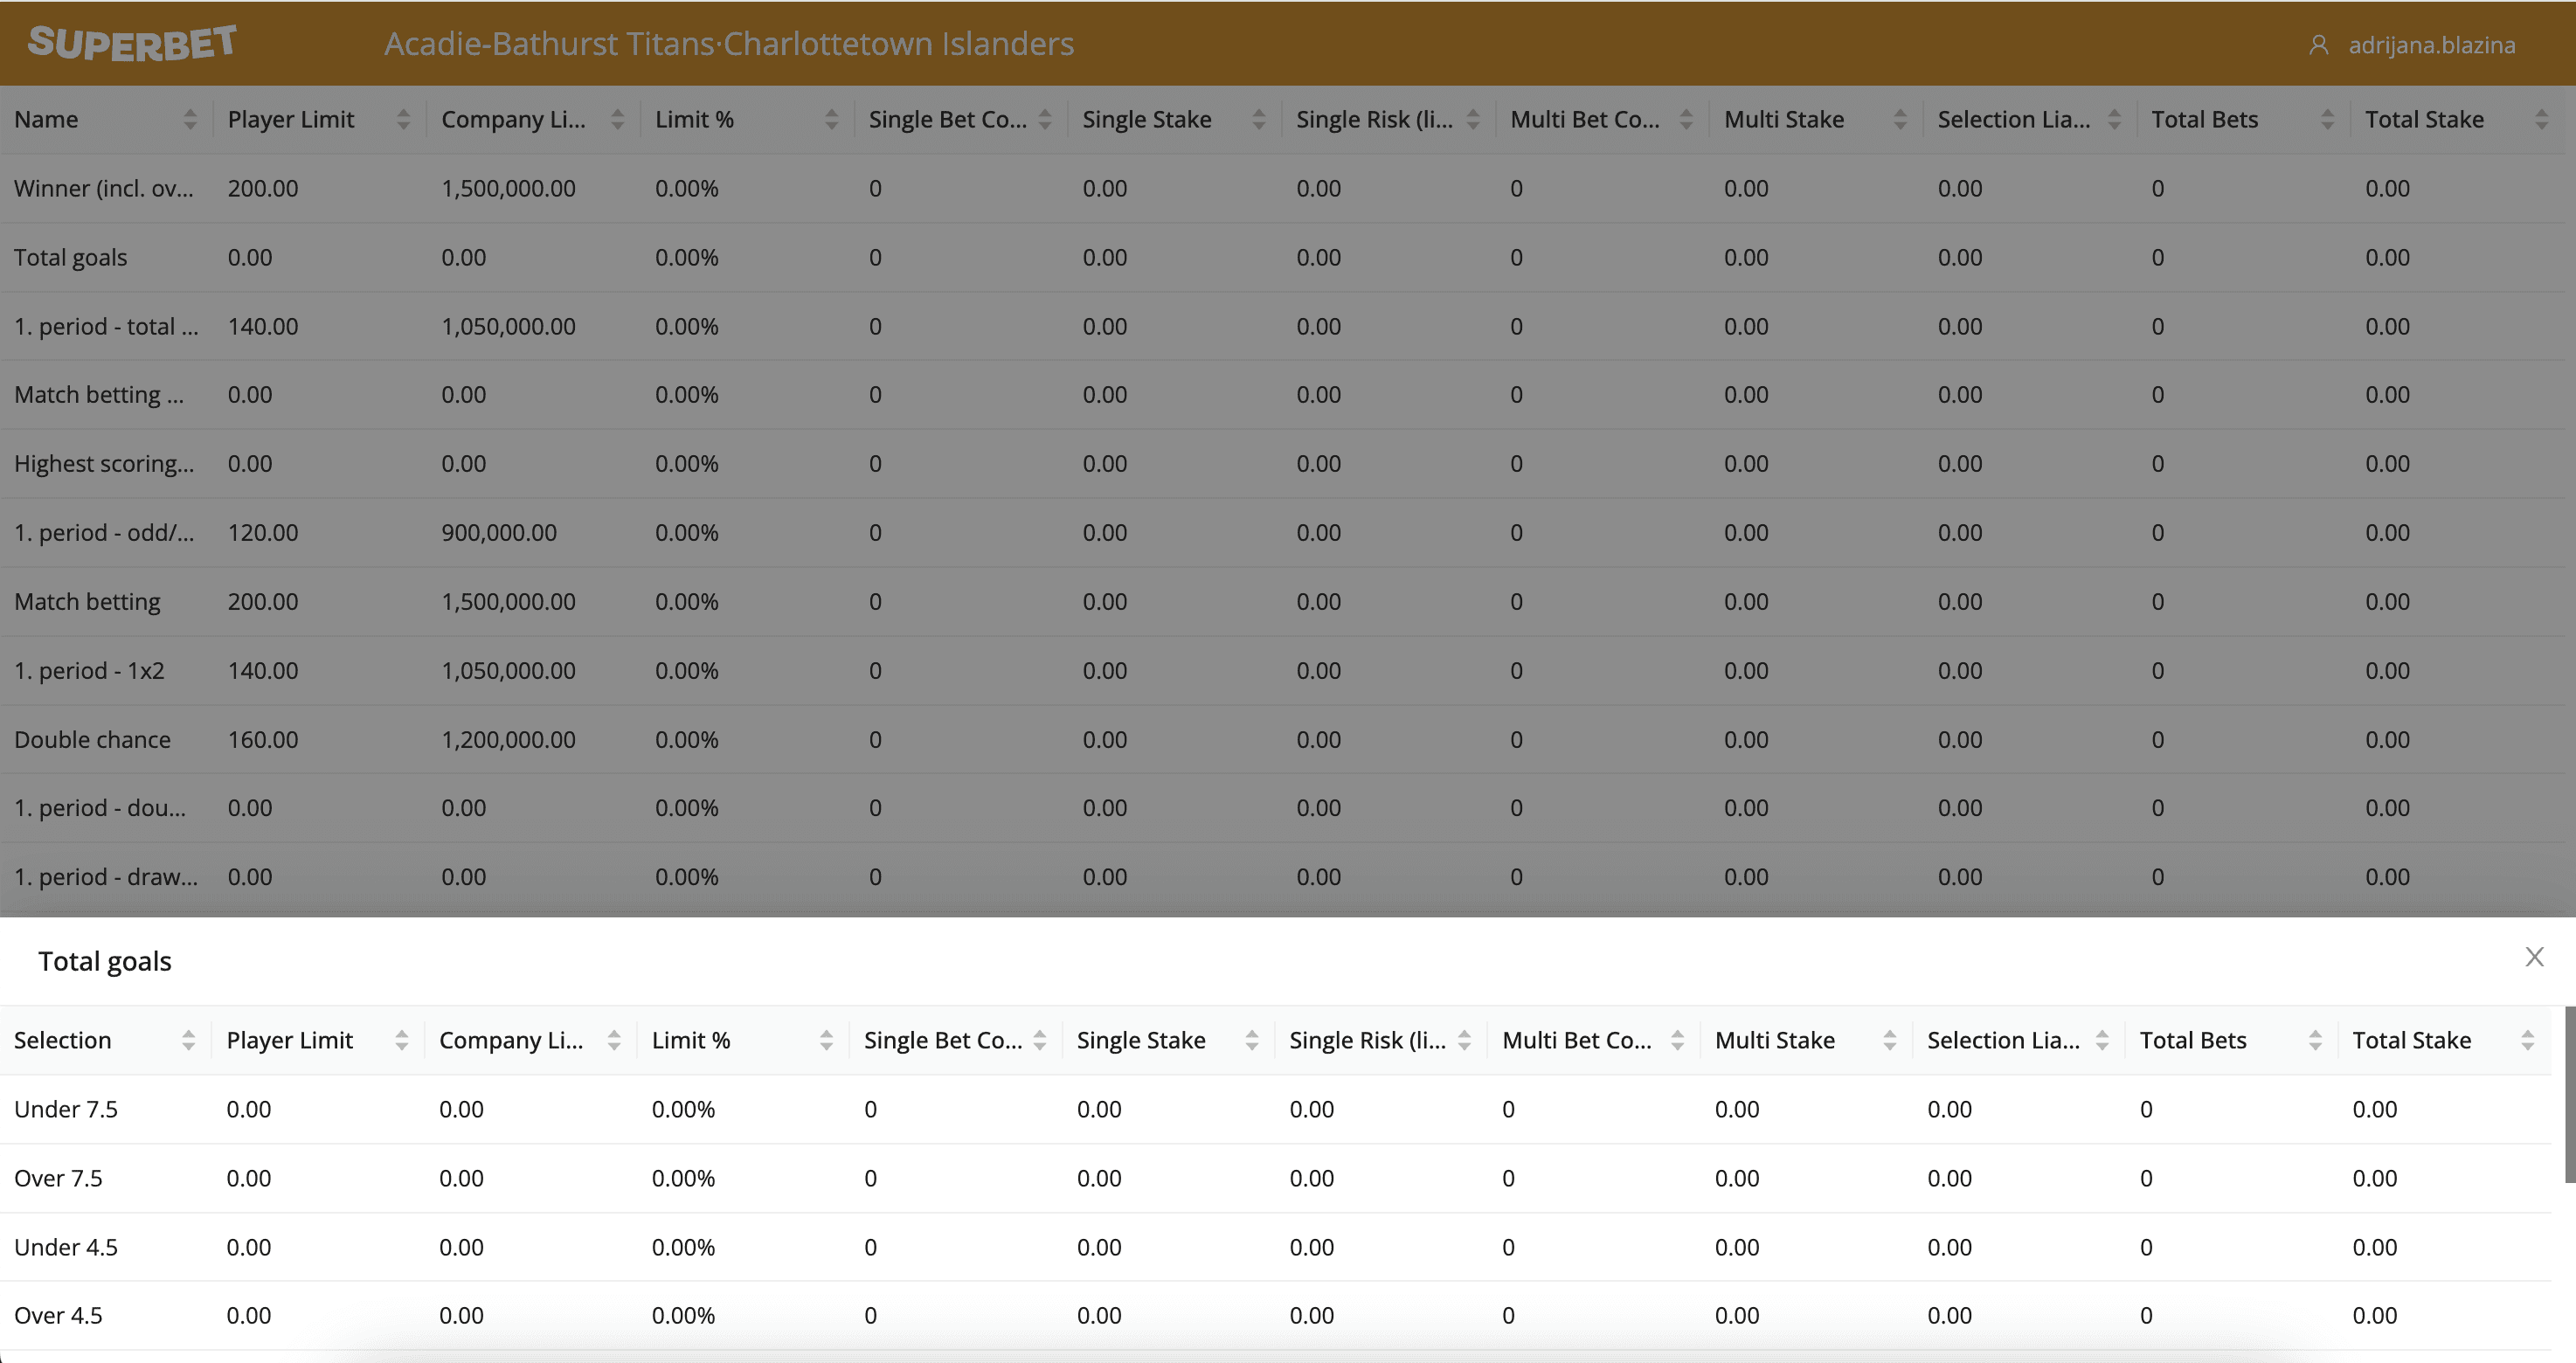
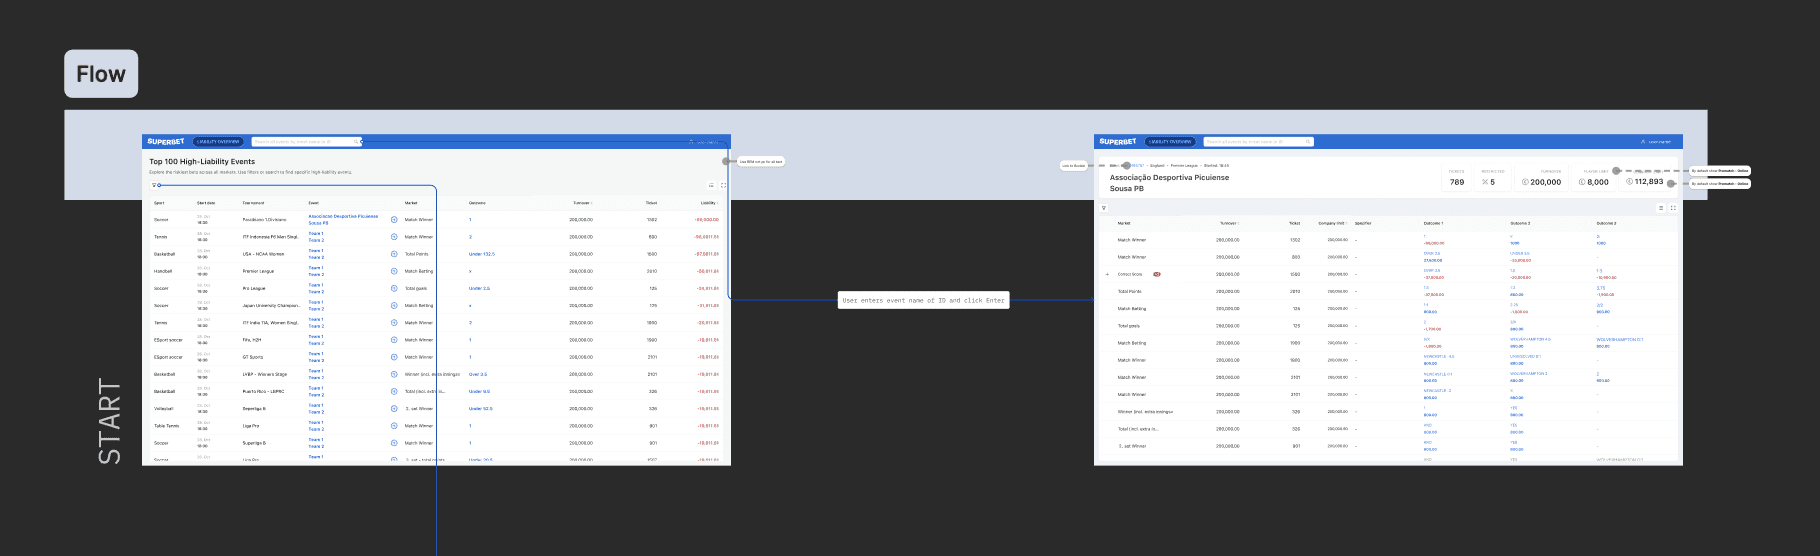
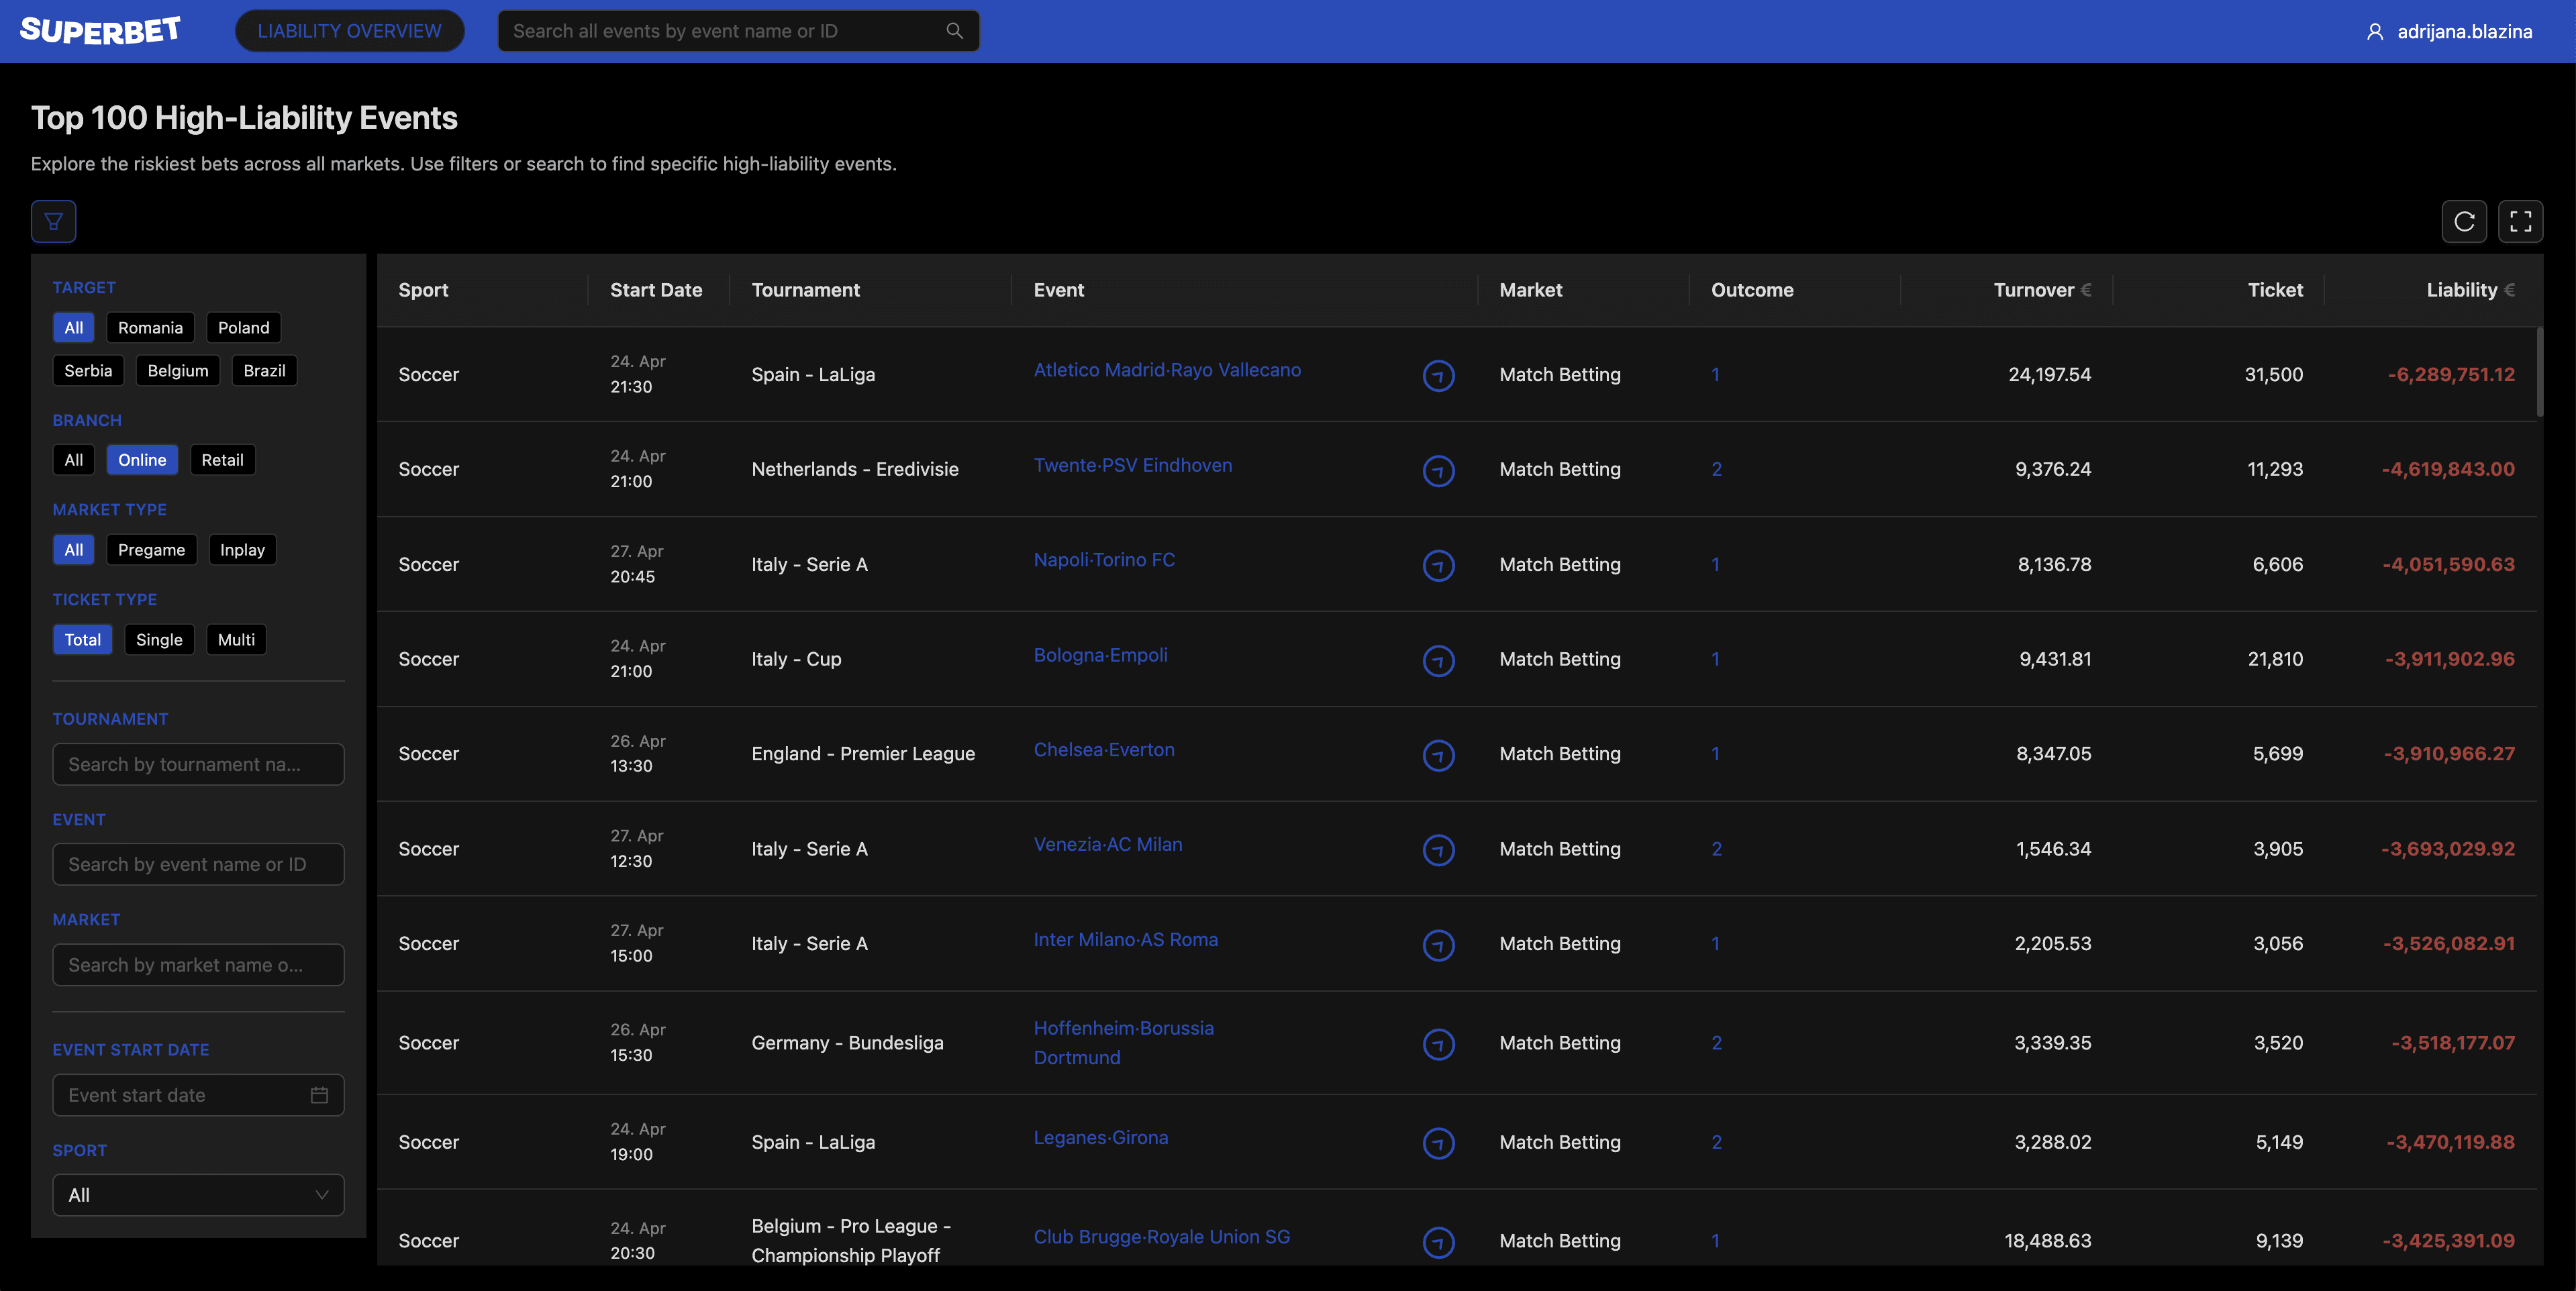
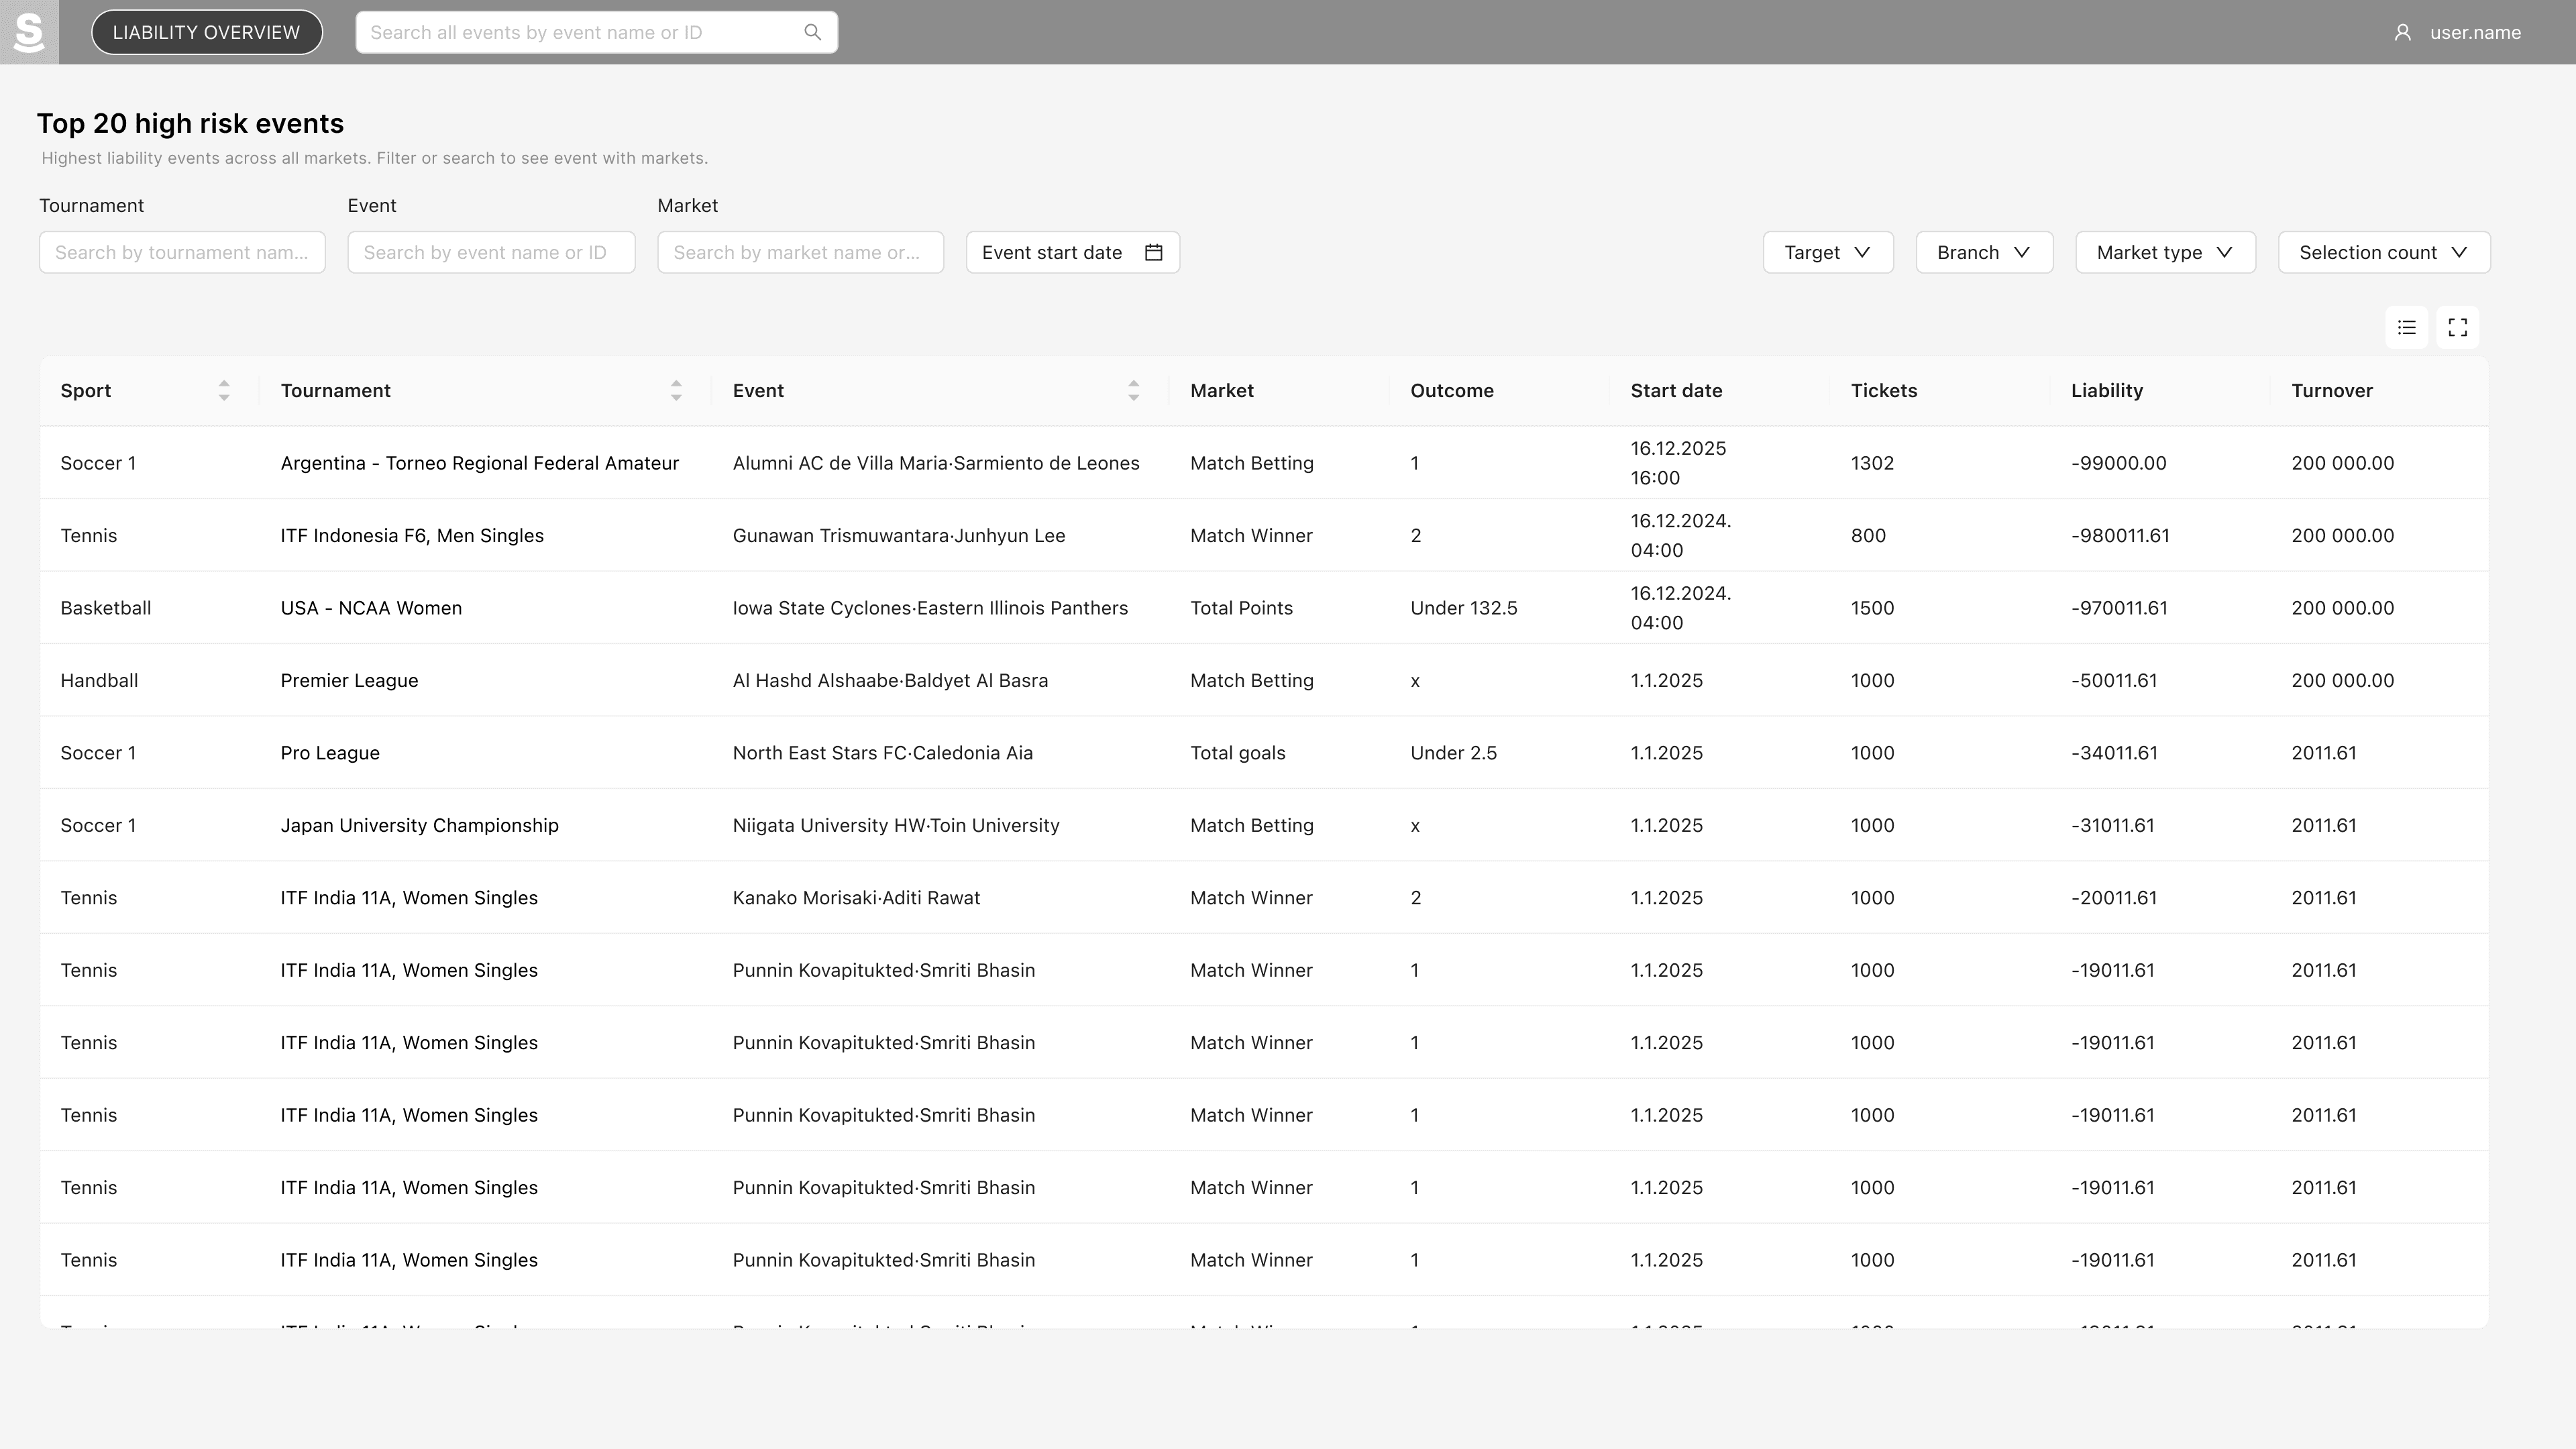
Liability Overview is a tool that helps traders track and manage financial exposure. Core Purpose: It shows our current open position of exposure - what we stand to win or lose should a real-world outcome happen. It displays the top 100 largest liabilities by default, helping traders quickly identify and assess risk.
After the project kickoff, we defined our research strategy and objectives, prioritizing an in-depth understanding of our target audience and their challenges.
While this is MVP, and first phase was finished, we still have a lot of work in front of us to suit everyones needs. There is an instant feedback regarding moving columns (in progress), add more filters, add new calcualtion like potential profit and average odds for markets.
For a liability overview tool that helps traders track and manage financial exposure, we created a set of potential business impact numbers that we will follow in next Q.
Reduction in Potential Losses
Improved Decision-Making Speed
"After three months of using the liability overview tool, the average monthly potential losses for traders will decrease by 20% compared to the three months prior to implementation."
"Traders using the liability overview tool will make decisions on high-risk trades 35% faster, on average, compared to the pre-implementation period."
We will track and compare the total potential losses for the three months before and after the tool's implementation.
We will measure the time taken from the initial risk assessment to the final decision on high-risk trades before and after the tool’s deployment.
User interviews
Analysis
Wireframing & Prototype
Usability testing
Dev handoff and reactions
Discovery findings in a nutshell
Prioritisation and requirements
Audit
After identifing and documenting the target audience, including specific stakeholders from trading and risk management data was collected through interviews and feedback sessions with six participants, including Pre-Match (PM) traders, In-Play (IP) traders, and other related roles. The research sought to identify key trends, challenges, and opportunities for enhancing the tool.
Description
Description
After discovery phase, we moved to ideation, where I led the design and prototyping phase. The goal was to bring concepts to life and test them with users.
Usability testing aimed to:
Validate prototype with real users.
Refine prototypes based on feedback.
We recruited users for testing from both our previous interviews and the respondent pool gathered through survey results.
Description
Description
“How we are trading? It's like fighting the World War III with the kitchen knife!”
Reaching out to tell you that we love the tool! It looks and feels good.
Will T.
Darko D., Project Specialist
Gerard M.
Cristian C., VP Product
Jack W.
Marcus B., Head of In Play Trading
“At the minute traders are trading in fog, they don't know exactly the numbers that we are getting until next day.”
I’m getting screenshots from people so they are obviously using it and thats a great sign!
“We lost a lot of money at the end Q4 ‘23 and it was because of bad luck, but how do you prove if it was bad luck or bad pricing?”
Definitely a great tool for the in-play side and understanding the liabilities. The team were looking at it whilst trading this weekend and found it very useful.
Describe what we did in audit of existing page and why.
I led through a double-diamond process, focusing on creating the vision in a lean, efficient and collaborative way
B2C
Discovery
Product Design
Product Management
User Research
discover
problem
solution
develop
deliver
DEFINE
Problem exploration
Explore ideas
Prototypes
Organizing research
Research
Wireframing
Adjusting
Narrowing and prioritizing features
User journey
Testing
Dev handoff
Launching
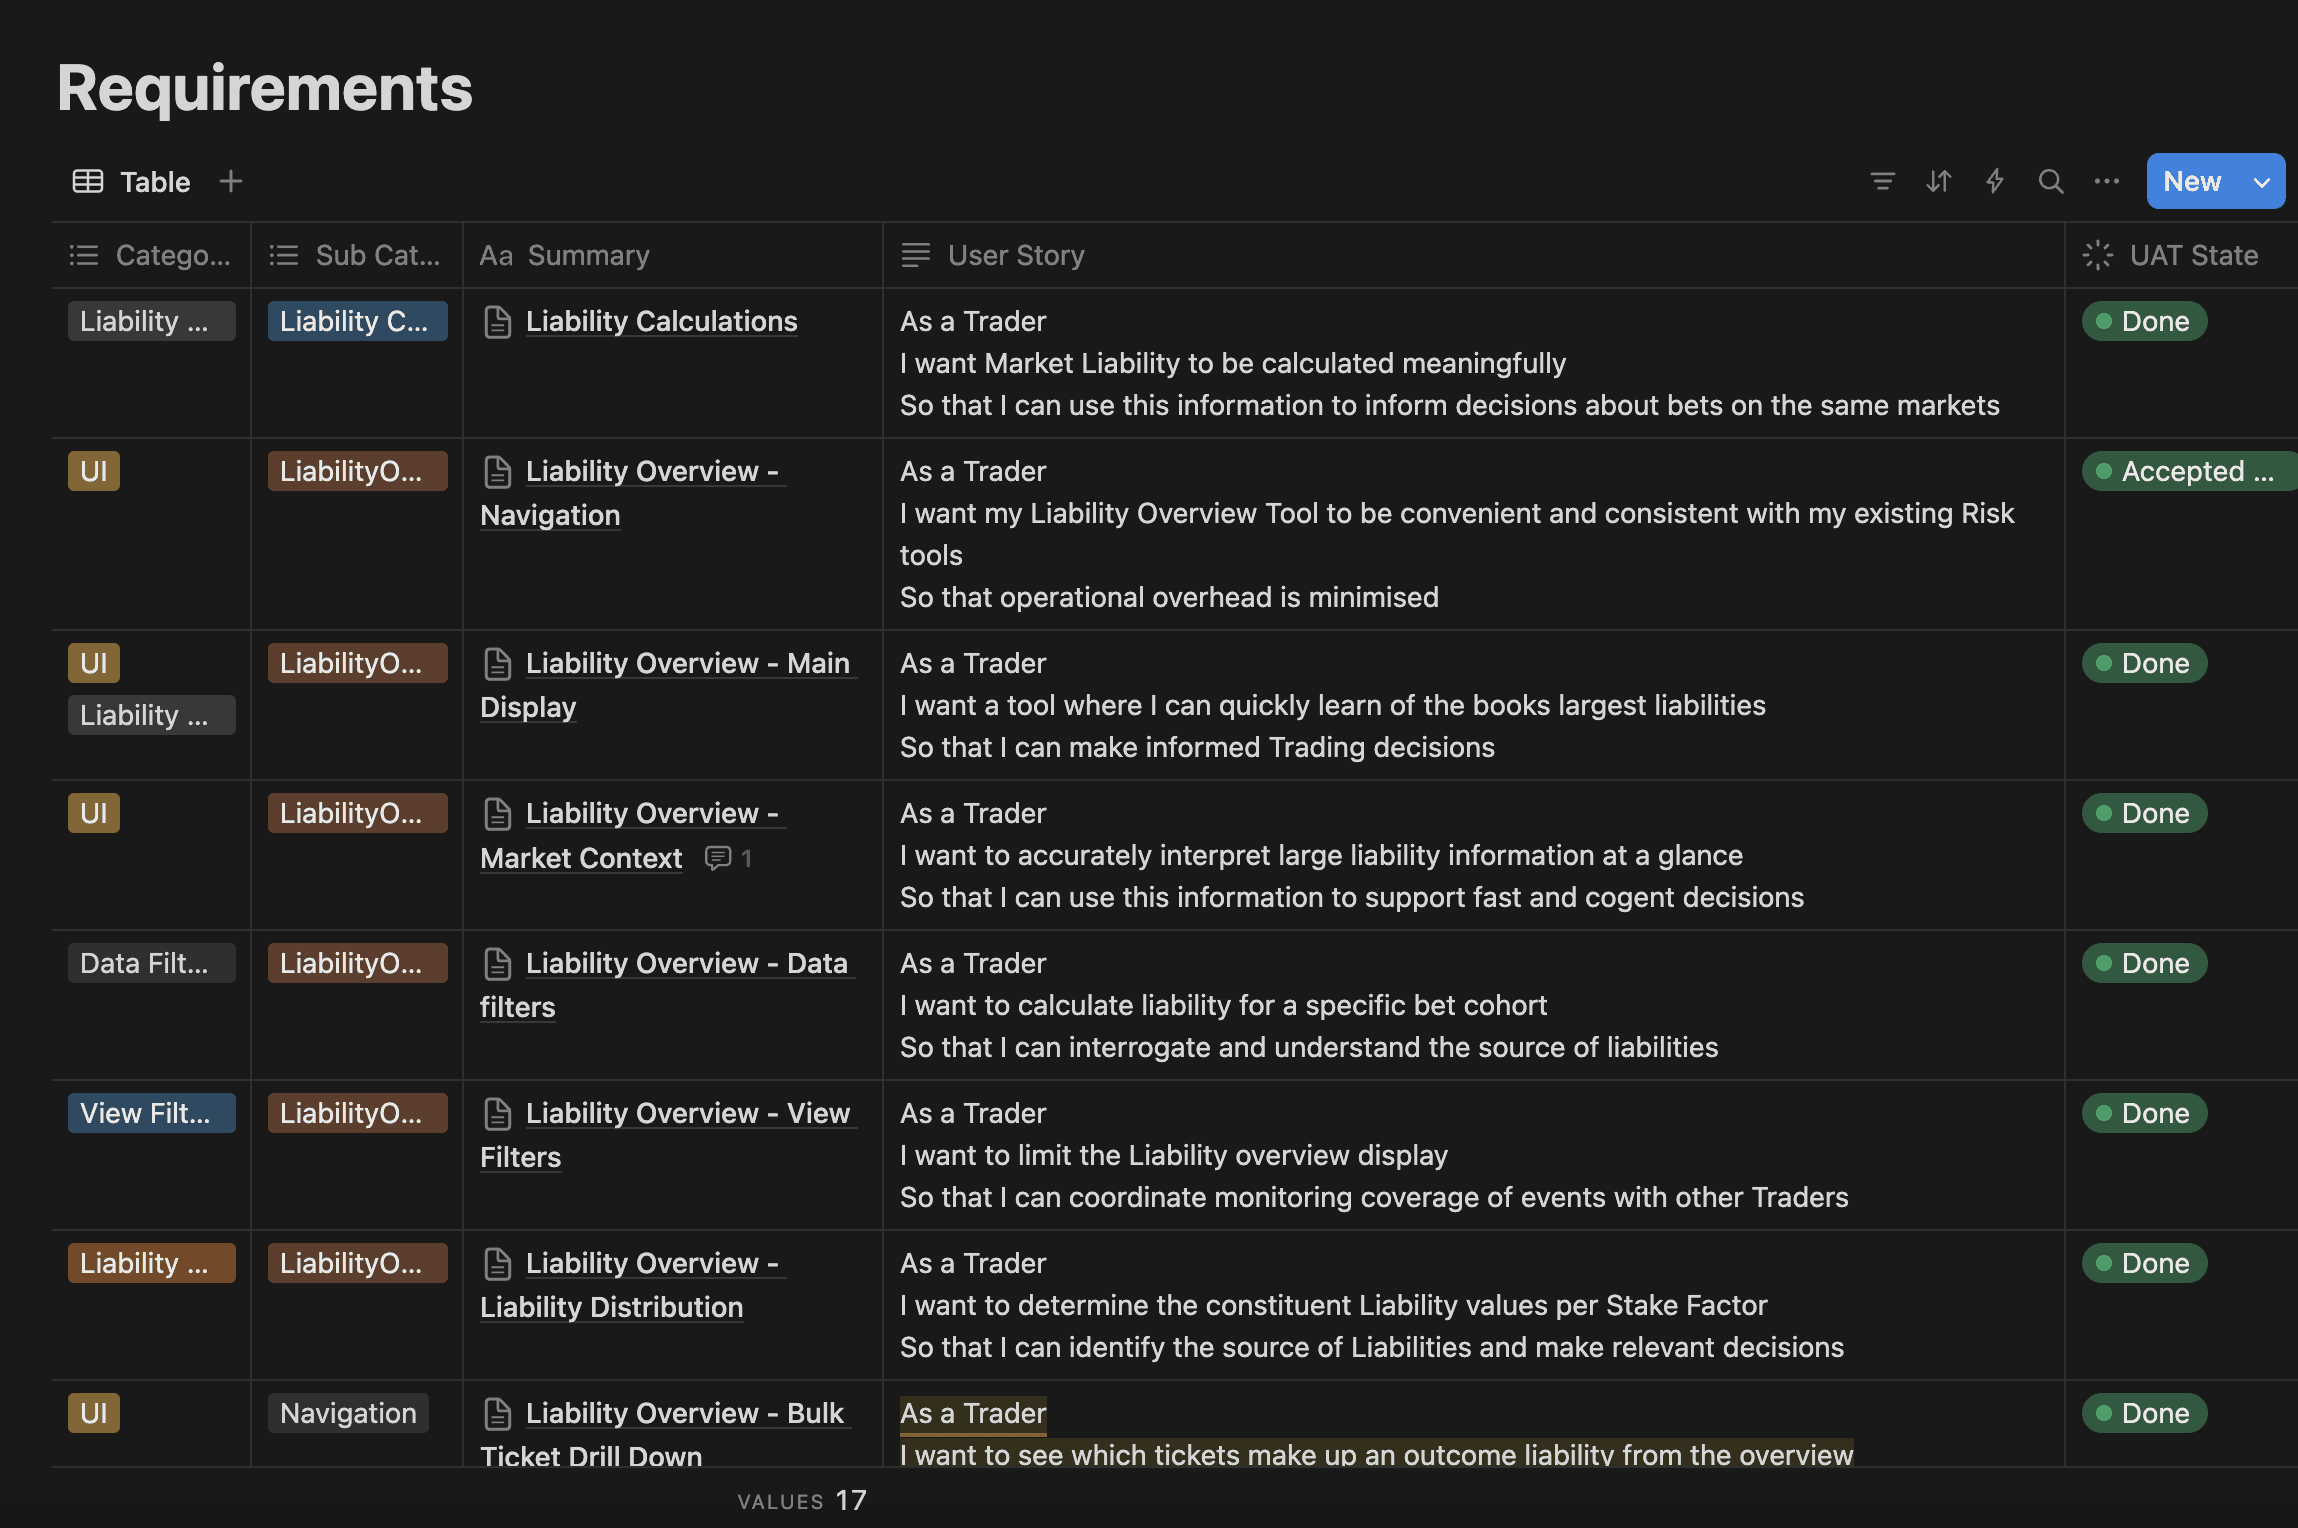
Defining requirements
WHAT?
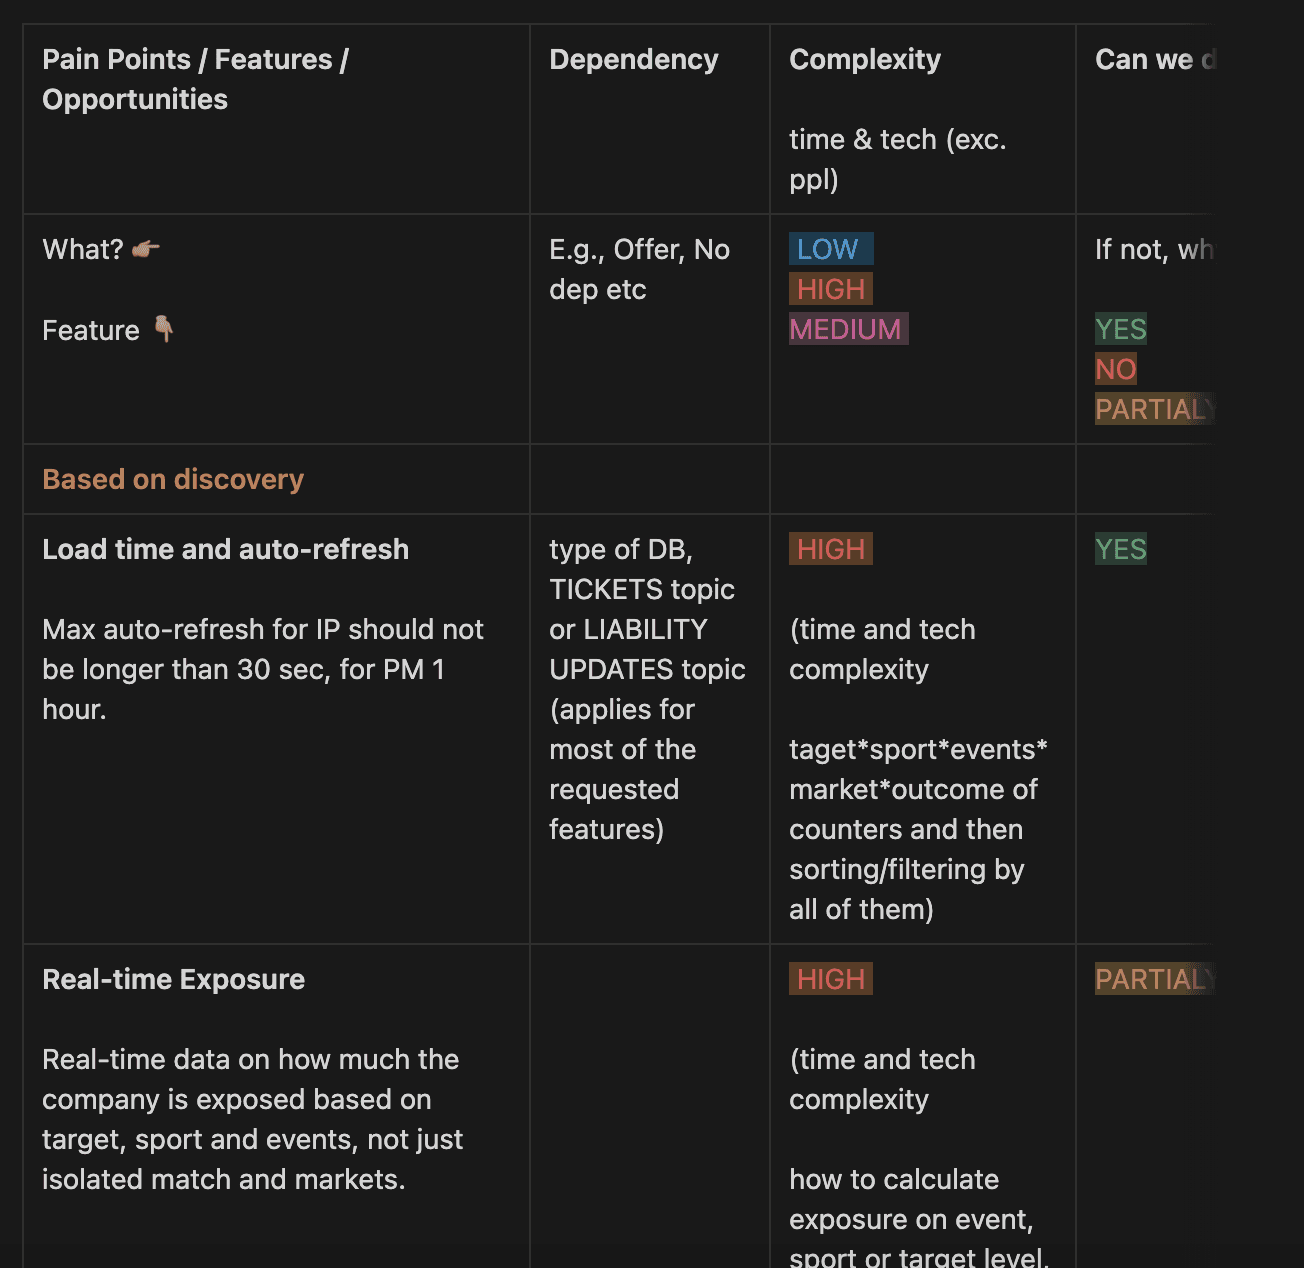
Our current liability tool is underutilized, unreliable, and difficult to use, with only 1 in 6 people using it due to frequent crashes, inaccurate data, information overload, and poor accessibility.
PERFORMANCE
Load time
Real-time exposure
DESIGN
Overview and Navigation
Filtering and Search
Data Display
Quick Actions
BIGGEST PAIN POINTS
64%
Adoption Rate
48%
WAU
78%
Completed onboarding
Impact